Gathering metrics in Elixir applications
Metrics are a fundamental part of most pieces of software. They’re a great insight on how a system behaves and performs, and can be used for different purposes, such as performance monitoring or alerting in case of anomalies.

Elixir is often praised as a fast language, especially for distributed, concurrent applications (like the ones we build at Forza Football). However, “fast” can be tricky to define without enough measurements available; without metrics, refactoring (especially aimed at improving speed) also becomes a risky thing to do, as it can be hard to determine if the performance is improving or not.
Let’s have a look at in what way and with what tools we gather metrics in our Elixir applications.
Overview of the stack
Our metrics architecture is roughly shaped like this:
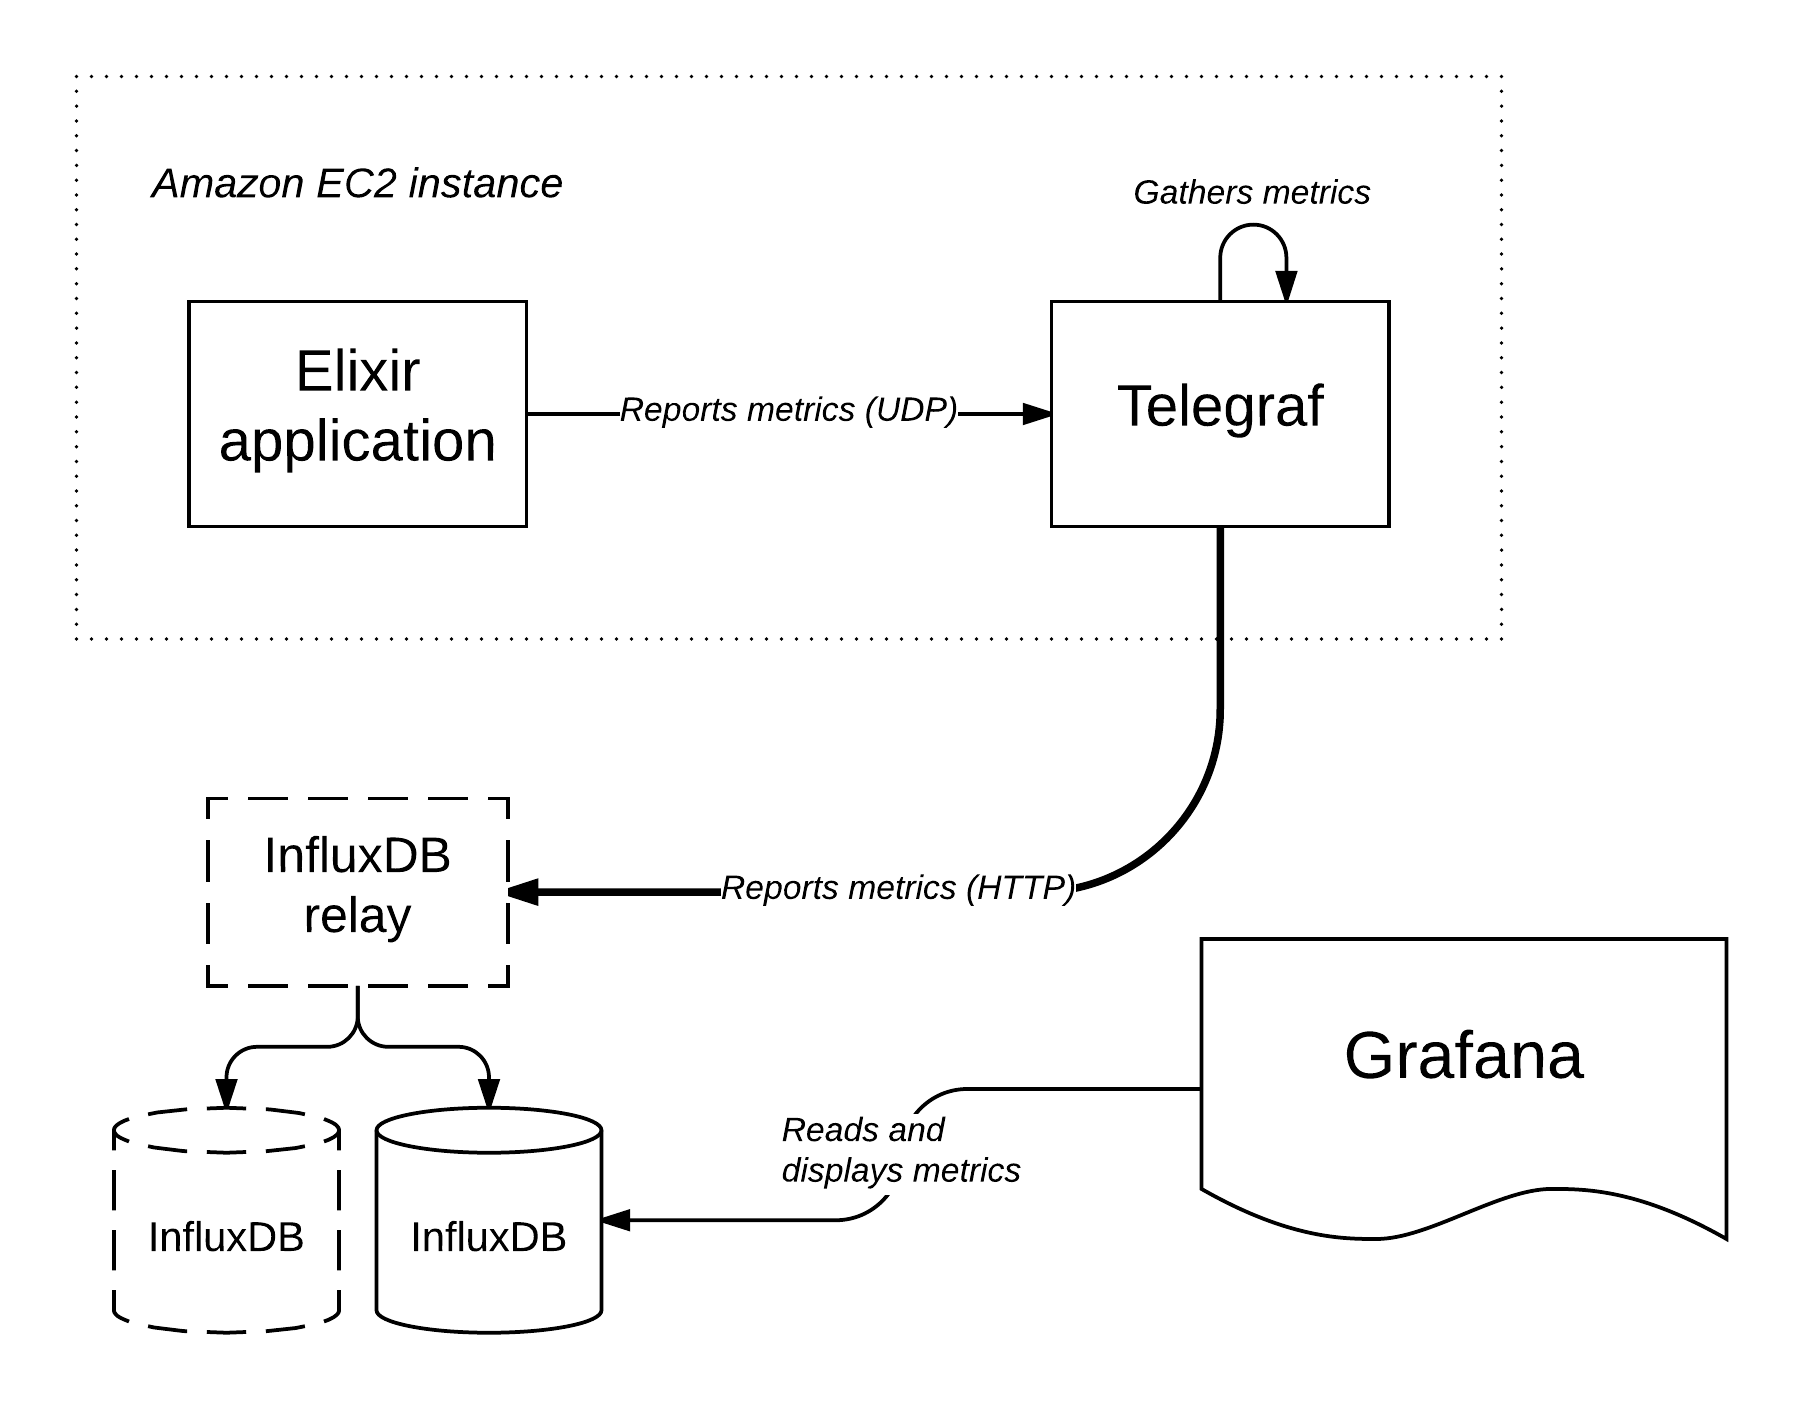
Let’s explore this architecture and the components that form it in more depth.
Storing metrics
Let’s start from the core of the architecture: the database we use to store metrics. We’re using InfluxDB, an open-source time-series database which suits storing metrics perfectly; it performs really well (it may be interesting to know it’s written in Go) and provides a bunch of very useful functionalities.
InfluxDB databases are formed by a set of measurements. Each measurement is a collection of data points; each data point (that’s the InfluxDB official term) is formed by a timestamp, a set of tags, and a set of values. Tags are for “tagging” the measurements with metadata about it: for example, a common tag attached to measurements is host, which holds the value of the host reporting the measurement. Tags are shared by all the points in a measurement. Values, instead, are the subject of the measurement - what is being measured. For example, a value could represent the time it takes to complete an HTTP request, and be called request_time. A data point can have multiple values; when a point has a single value, we often call that value just value, since the measurement name will be enough to determine what that value represents. In the rest of the post, we will often refer to “measurements” as both measurements and points, to make the reading experience more fluid.
InfluxDB also provides a rich SQL-like language to query the data it stores, and ways to resample data for optimal storing. We won’t look at either of those in this post; if you’re interested, check out their documentation.
InfluxDB supports a couple of ways to store data in it: measurements can be reported via an HTTP API or via an UDP interface, and can be encoded either as JSON or using InfluxDB’s own “line protocol”. The UDP interface is naturally faster since it lacks the overhead of something like the HTTP protocol and the TCP transport; however, as always, it provides close to no guarantees of successful delivery of data. Choosing between the HTTP API and the UDP interface can be hard, but we will see how it’s possible to avoid this choice completely and get the best of both worlds.
Last but not least: to improve the availability of InfluxDB and be more conservative with our metrics, we use influxdb-relay, which sets up a simple load-balancer-like architecture to add some replication to the metrics storage. This only works for writing metrics though, so we point directly to an InfluxDB instance when we need to read metrics.
Reporting metrics
The most straightforward way to report metrics to InfluxDB would be to send them directly from our Elixir applications to InfluxDB, using either the HTTP API or the UDP interface mentioned in the previous section.
This choice, however, is a tough one for us: we have a high load of metrics, and we often need to report hundreds of thousands of metrics in a matter of seconds. This brings out disadvantages in both reporting methods: using the HTTP API would mean slowing down our applications, which is not something you want metrics reporting to do, but using the UDP interface would mean risking to drop metrics, especially because of the substantial number of metrics being reported.
Telegraf
Luckily, the same folks behind InfluxDB provide another nifty open-source tool called Telegraf. Telegraf is basically a daemon that can collect inputs from different sources and delivers it to different outputs every n seconds; both inputs and outputs are managed via “input plugins” and “output plugins”. We’re using primarily two main input sources, and one output.
Inputs
The inputs that Telegraf is gathering for us are two. The first one is “system metrics”, meaning system data such as CPU usage, memory usage, disk usage, network usage, and so on. Telegraf takes care of reading this measurements out of the box. The other input we’re using is the UDP listener built into Telefgraf: this plugin provides a “mirror” of InfluxDB’s UDP interface, exposed locally through Telegraf. This is useful: for example, it means InfluxDB bindings in different languages can be built to work with the UDP interface, and automatically work with running instances of both InfluxDB as well as Telegraf. Fun fact: me and @lexmag actually contributed this plugin to Telegraf because it was just perfect for our needs!
Outputs
We’re using only one output plugin: the InfluxDB plugin. This plugin is straightforward: it reports measurements gathered via input plugins to InfluxDB. It also provides some niceties such as global tags that can be applied to all measurements from every input plugin (we use this to set the host tag for both application and system metrics) and measurement filtering. But for us the most useful feature is that this plugin talks to InfluxDB’s HTTP API instead of UDP interface: this means that we can rely on the guarantees that HTTP (and the underlying TCP transport) provide to ensure metrics arrive to the InfluxDB server.
Aggregation
For us, Telegraf works as a middlemann between our application reporting metrics and InfluxDB, and this has multiple advantages:
- We can use the UDP interface to send metrics from our Elixir applications to Telegraf; this greatly benefits the speed at which we can report these metrics, and, since Telegraf is running locally, the risk of losing packets because of UDP is substantially reduced; since Telegraf reports these metrics to InfluxDB via HTTP, the chance of losing measurements is very low.
- We can throttle the number of measurements that are reported to InfluxDB: Telegraf aggregates metrics for n seconds (usually 5 or 10 seconds is a good number, depending on the application), before sending them to InfluxDB. This means that Telegraf will only send bulks of metrics to InfluxDB, once every n seconds, reducing the number of hits to InfluxDB and the network traffic.
Telegraf/InfluxDB driver
When we started using InfluxDB and Telegraf, there were no Elixir drivers for InfluxDB’s UDP interface (we could only find one for InfluxDB’s HTTP API). But fear not: we built one! Fluxter is a straightforward Elixir library that provides a pool of UDP connections to InfluxDB/Telegraf (it doesn’t know the distinction, since the UDP protocol is the same) and a simple API to report metrics.
Each Elixir application has its own Fluxter module:
defmodule MyApp.Fluxter do
  use Fluxter
end
The code above turns MyApp.Fluxter into a supervised pool of UDP connections. To make things fault-tolerant, we make sure to start this pool under the application’s supervision tree:
def start(_type, _args) do
  children = [
    MyApp.Fluxter,
    # ...
  ]

  Supervisor.start_link(children, strategy: :one_for_one)
end
Finally, we configure the pool via the application’s configuration:
# Assuming Telegraf is running on localhost:8086, and has the UDP input running:
config :fluxter,
  host: "localhost",
  port: 8086
Then, once the Fluxter pool is started, we can easily report metrics through it:
def my_operation() do
  # Perform my operation
  MyApp.Fluxter.write("something_done", [my_tag: "foo"], 1)
end
For more information on Fluxter, you can consult its documentation.
Erlang VM metrics
Given we report metrics for everything, we couldn’t skip metrics from the Erlang VM: we gather detailed information about number of running processes, memory usage, process mailboxes, garbage collection, and more. To do that, we use vmstats, a tiny Erlang application that collects measurements from the Erlang VM and reports them to a “sink”: a sink is just an Erlang/Elixir module implementing the :vmstats_sink behaviour. We use the Fluxter pool as the sink, and we have an identical setup for it in each of our Elixir applications:
defmodule MyApp.Fluxter do
  use Fluxter

  @behaviour :vmstats_sink

  def collect(_type, name, value) do
    write(name, value: value)
  end
end
Have a look at vmstats’ README for more information on what it can do.
Counters
Since we report a very high number of metrics in a very short span of time, we experienced trouble with this setup, since each reported measurement would mean a UDP packet sent to Telegraf (which makes things prone to overflowing and packets get easily lost). For this reason we introduced counters in Fluxter: a counter is simply another level of aggregation of numeric measurements, at the Elixir level this time. Counters will add every measurement reported to them and only send the final sum to Telegraf/InfluxDB when “flushed”.
counter = MyApp.Fluxter.start_counter("my_operation_success", host: "eu-west")

Enum.each(1..1_000_000, fn _ ->
  my_operation()
  MyApp.Fluxter.increment_counter(counter, 1)
end)

MyApp.Fluxter.flush_counter(counter)
Visualizing metrics
All the metrics we report and store would be close to useless without a way of visualizing them. As our visualization tool, we use Grafana, which has native support for InfluxDB (meaning it can query InfluxDB out of the box) and which packs a ton of useful features.
Our dashboards look roughly like this one:
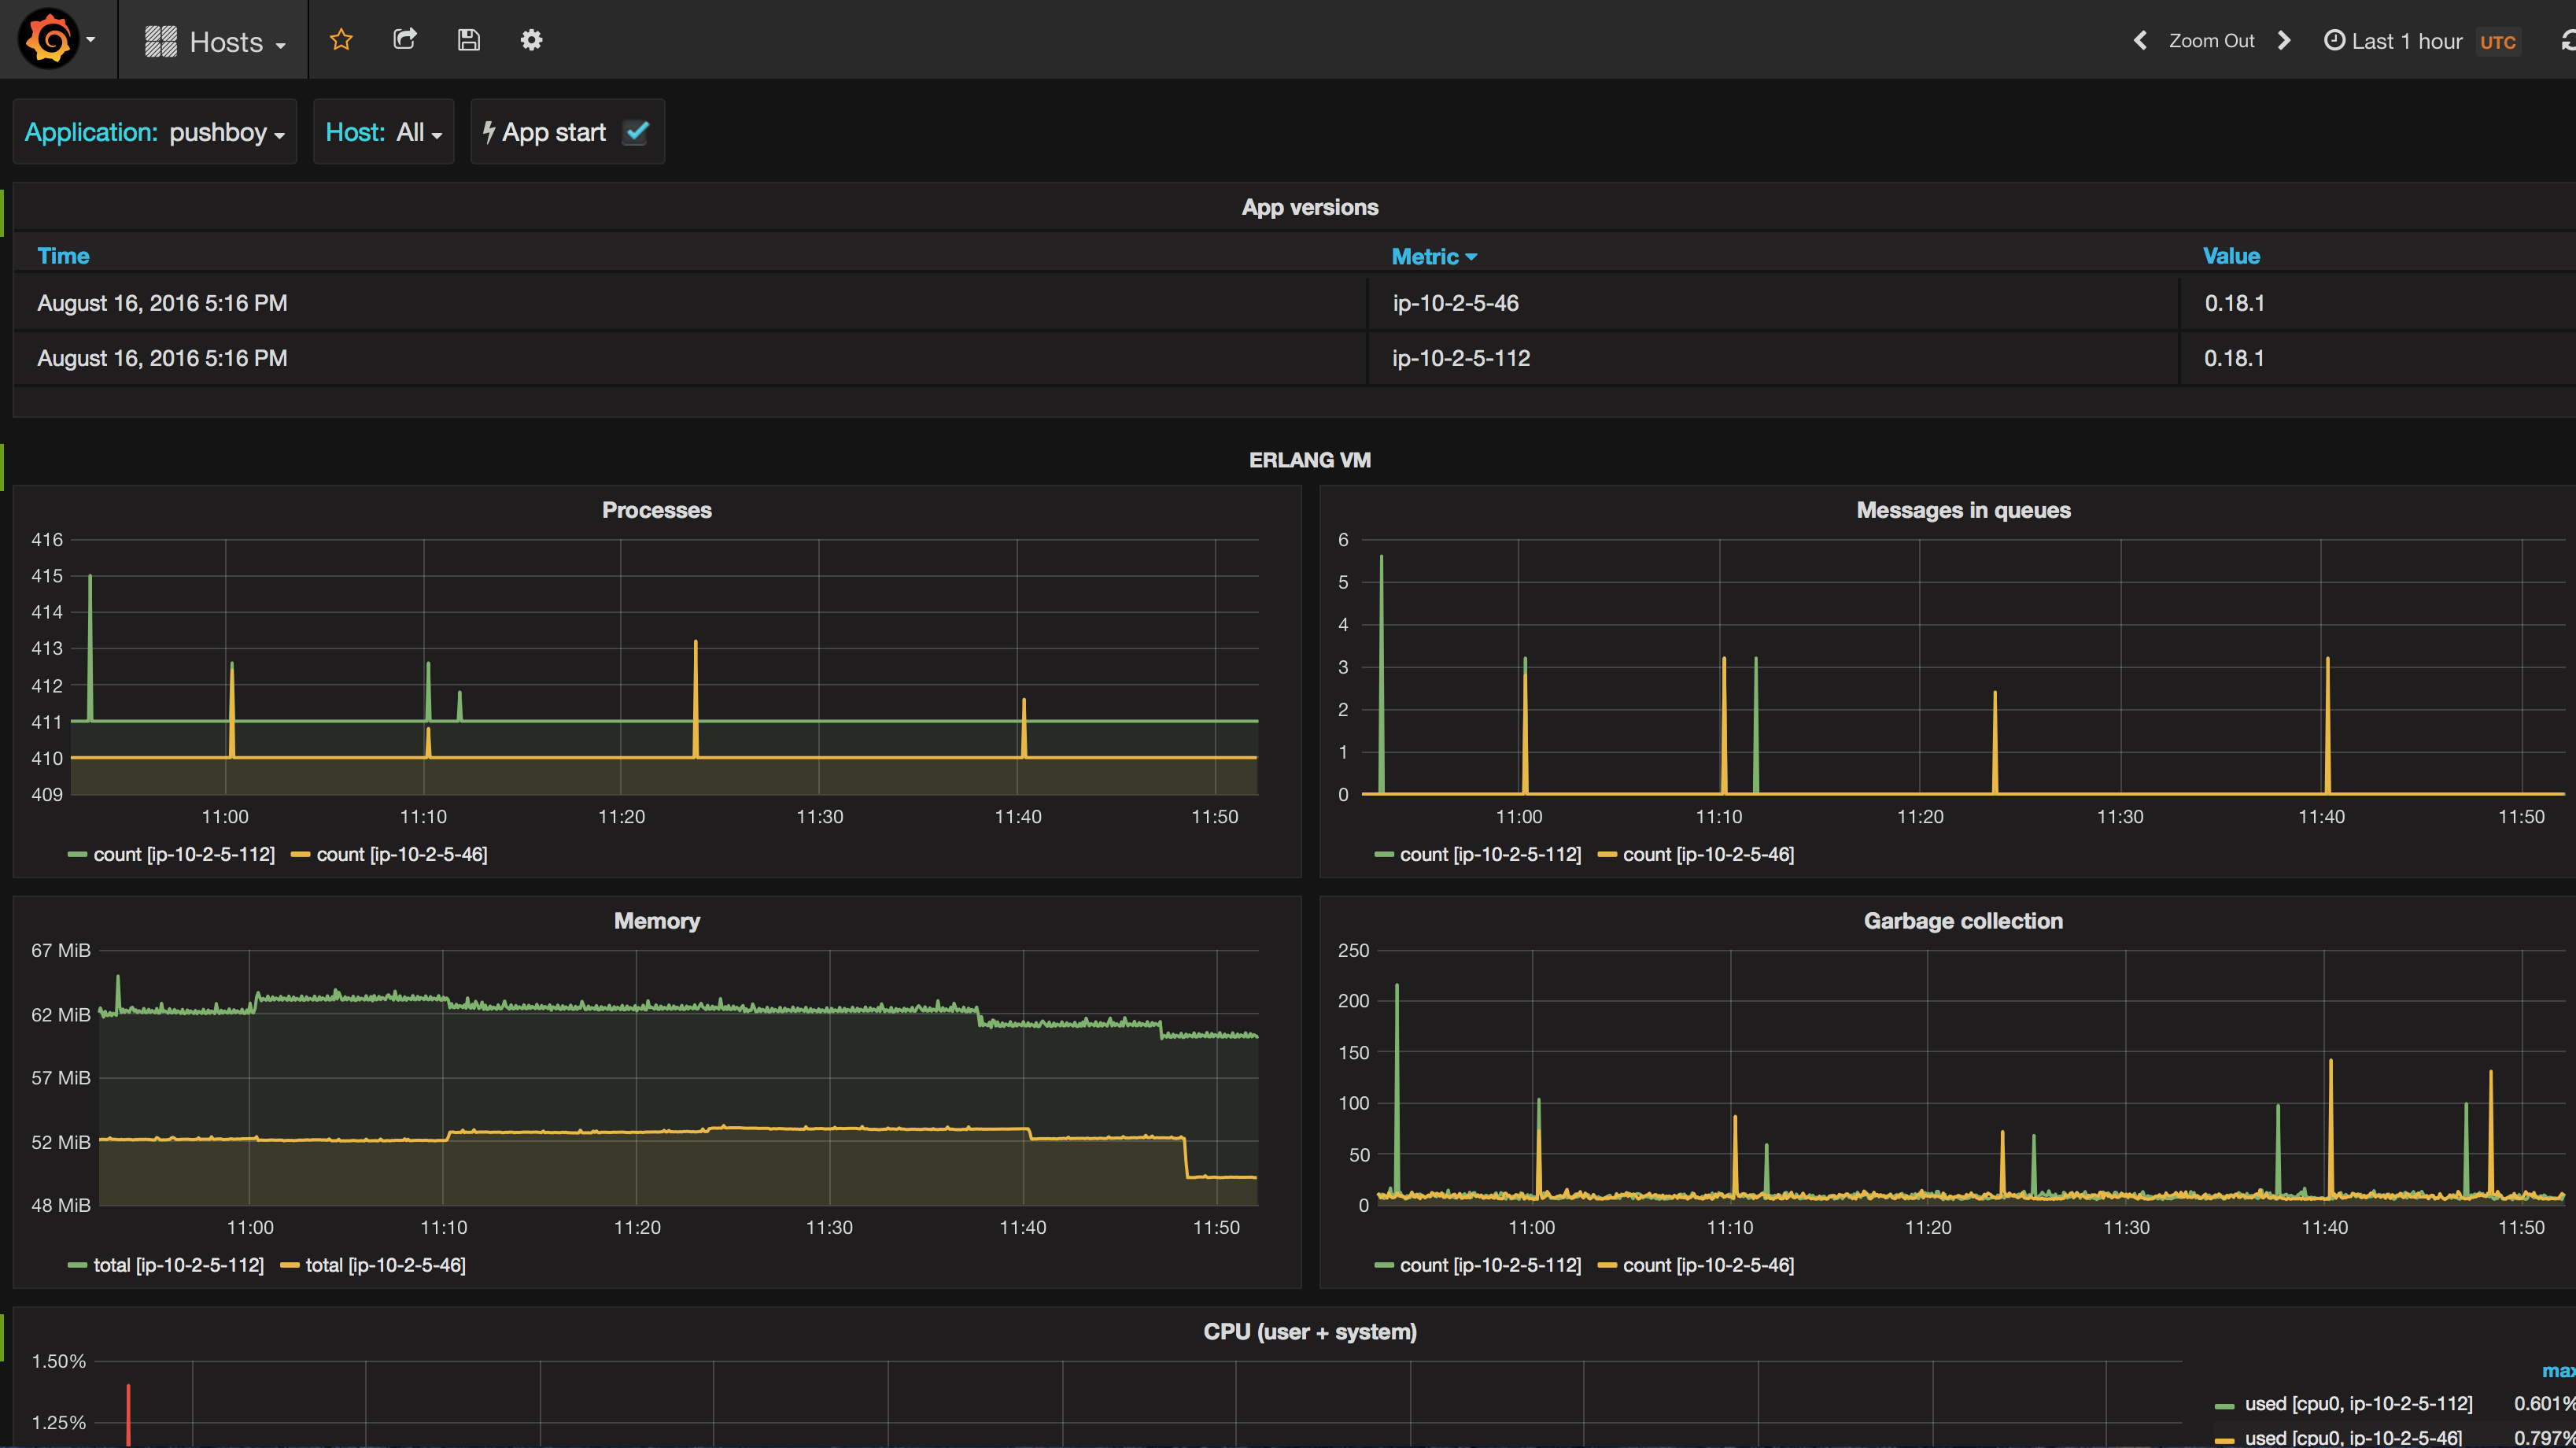
The dashboard above is the one that we use to monitor the health of all our applications: it shows metrics from the system and from the Erlang VM. The select box on the top left corner (where it says “pushboy”) lets us choose which application to visualize metrics of, so that we can have an overview of the system and Erlang VM metrics for each application with just a couple of clicks.
Grafana provides several useful features: for example, it can group measurements by tag (for example, useful for showing each host in a cluster as a different line on a graph), it can perform all sorts of aggregations on the data, and is very customizable in its appearance.
Grafana is probably the simplest part of the whole architecture, but a crucial one nonetheless.
Alerting
We mainly use metrics to have an insight on how our applications perform, but we also take advantage of them for another thing: alerting. Metrics can be often bent to communicate the health of an application: for example, if the number of Erlang processes in one of our applications goes way up the average value, we know it’s something we should look into.
The lovely people behind InfluxDB and Telegraf have this covered as well with another open-source tool called Kapacitor. Kapacitor is a daemon that can repeatedly perform queries on InfluxDB and act on the results of such queries. Kapacitor works by interpreting “Kapacitor scripts”, which are scripts written in a Kapacitor-specific language. A lot can be achieved with these scripts, but let’s keep it simple for this post: the script below is taken directly out of our system and shows how we use the Erlang VM metrics gathered by vmstats to determine the health of the application.
stream
  |from()
    .measurement('pushboy_vm_modules')
  |groupBy('host')
  |deadman(15.0, 1m) //
    .id('Pushboy [{{ index .Tags "host" }}]')
    .message('{{ .ID }} is {{ if eq .Level "OK" }}up{{ else }}down{{ end }}')
    .stateChangesOnly()
    .slack()
This small script checks for the vm_modules measurement and triggers an alert if the throughput drops below 15 points per minute (a healthy application with our configuration reports around 60 points per minute). As you may guess by the last line, this script will notify us by posting on a Slack channel (which is specified in Kapacitor’s configuration). Kapacitor supports several ways of notifying about alerts other than Slack, such as PagerDuty or email.
Conclusion
This post showed how we gather as many metrics as we can from our Elixir applications (and the servers they run on) and how we use them to monitor the health and performance of such applications and to get alerts when problems arise. We’re quite happy with this system, as it works almost flawlessly and has made us much more scientific in our approach to software development: we now tend to experiment, gather data, and draw conclusions based on data instead of relying a bit too much on our gut.